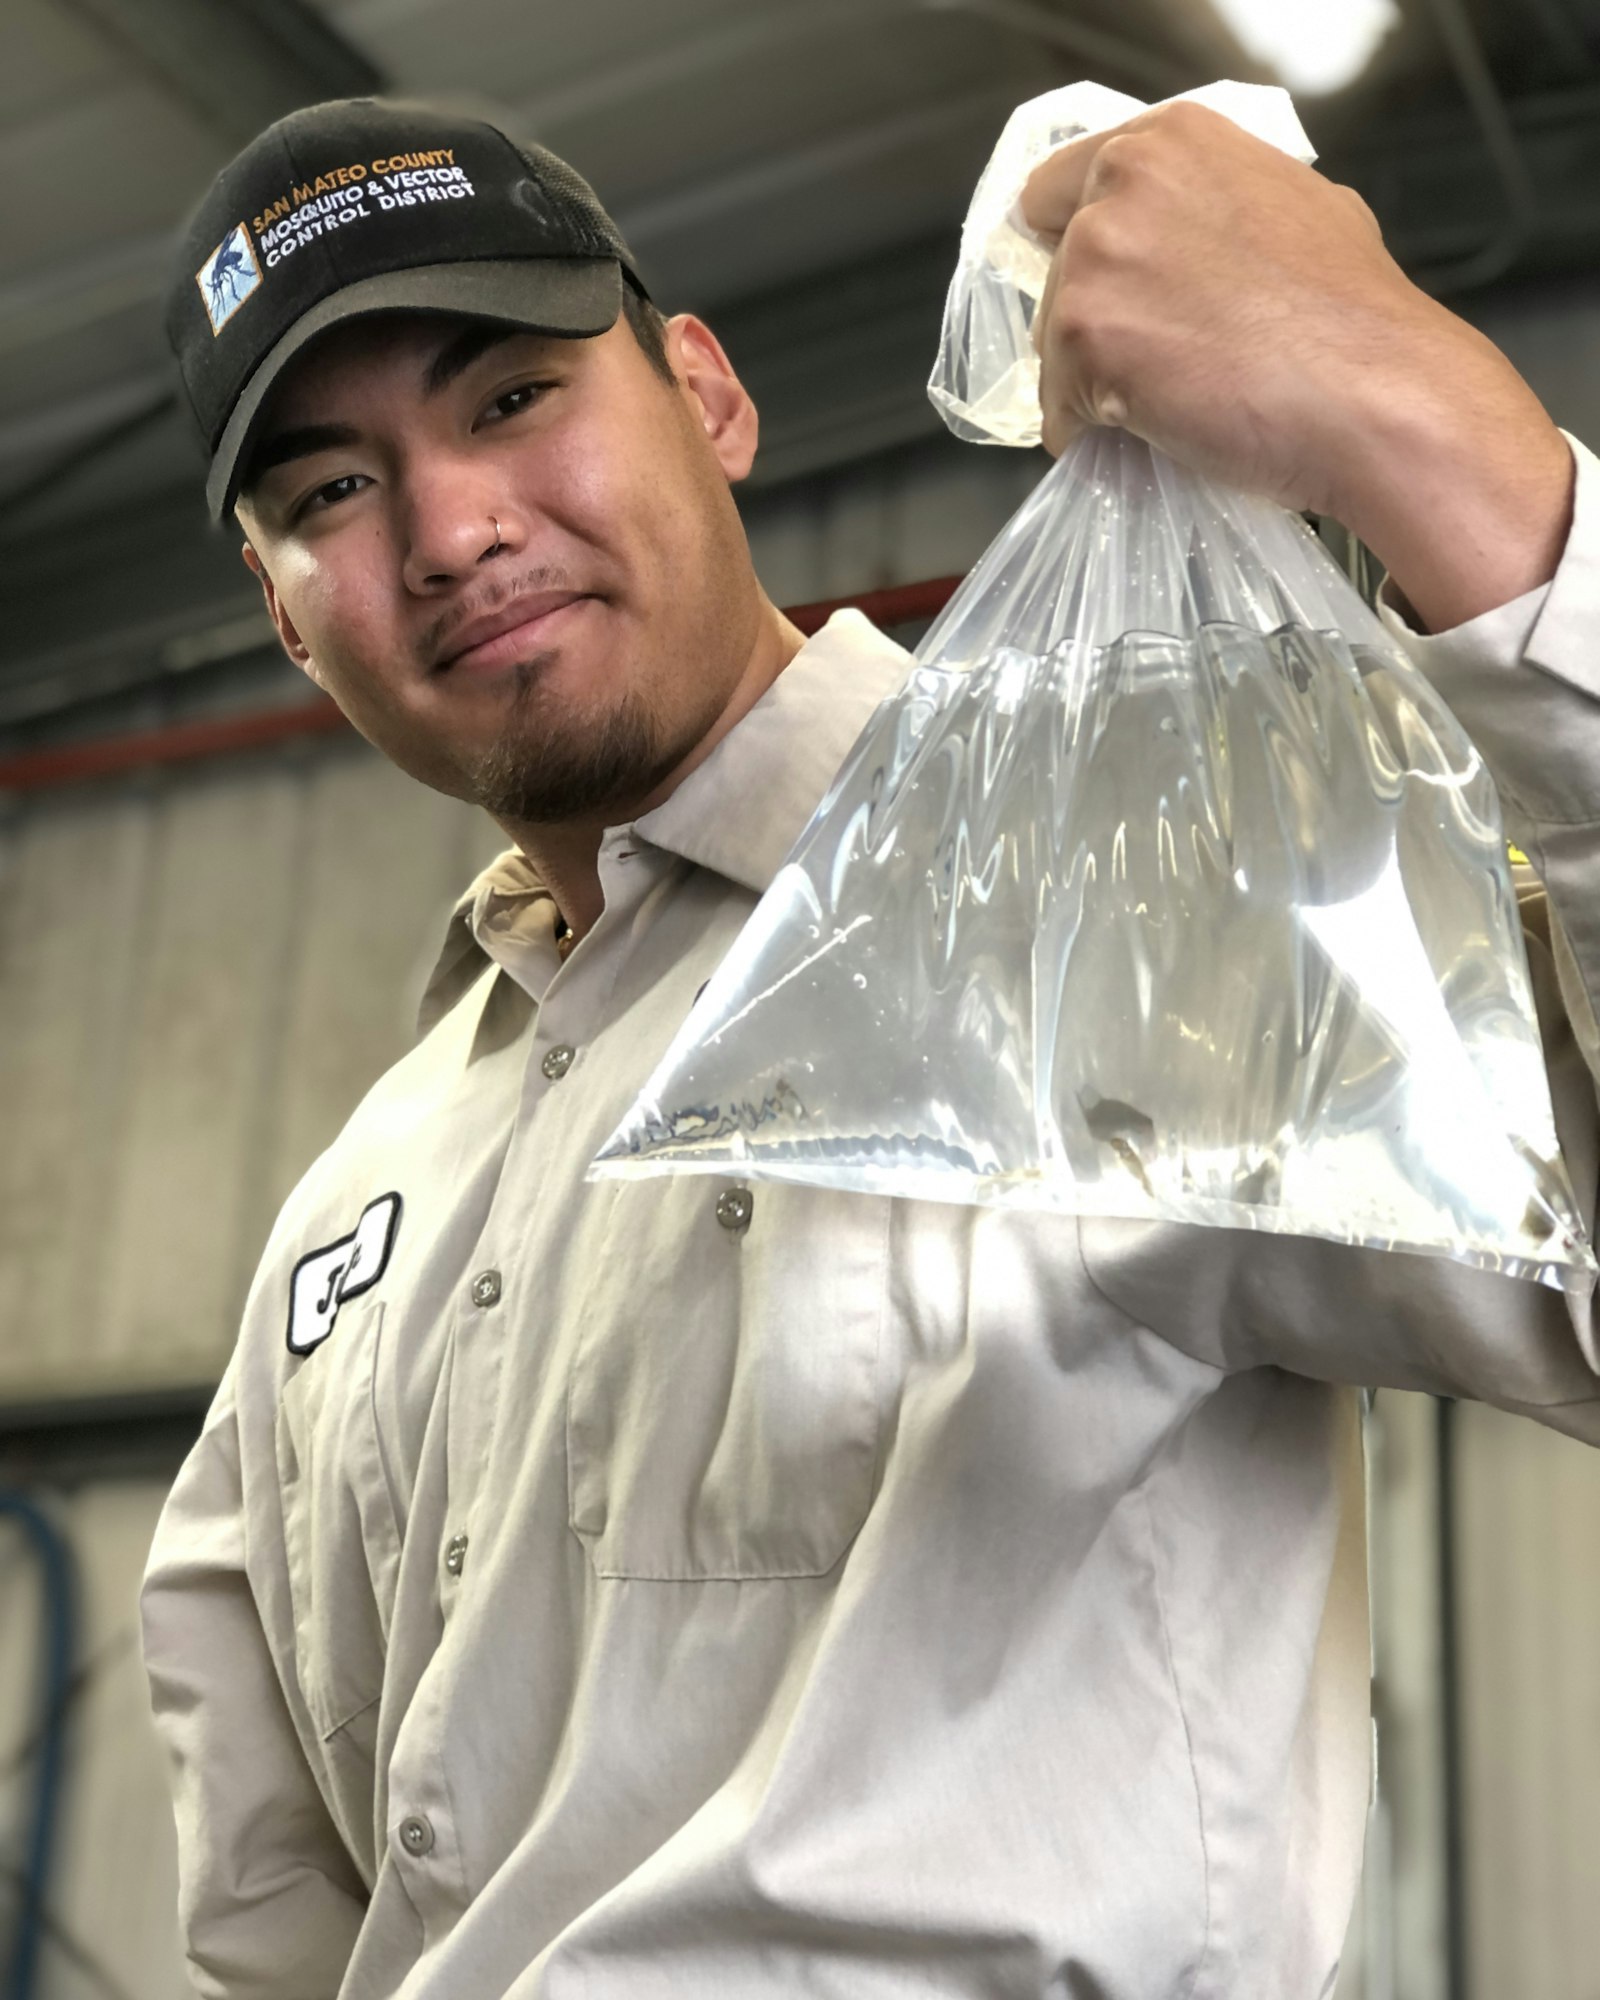
Vector Control Technician Justin prepared mosquitofish for a fishpond.
The total number of service requests this December are above the five year average for the month (169 compared to an average of 124). This is is because of a substantial increase in rodent and tick requests during December. Tick requests are higher than average because of a project involving residential yard tick inspections that has only been underway for only one year. As the District re-starts its checks for ticks in residential backyards, the number of tick-related service requests has started to increase, and will continue to increase over the next few months. Learn more HERE.
The“other” category included arthropod-related requests regarding mites, bees, gnats and ants.
Type of Request
December 2023
December 5-year average (2019-2023)
Rodents
71
42
Ticks
28
11
Mosquito
26
22
Yellowjackets/wasps
16
26
Insect identification
8
7
Dead birds
7
5
Wildlife
6
3
Mosquitofish
4
4
Other
3
4
Total
169
124
Page last reviewed: January 9, 2024
Sign up for updates from San Mateo County Mosquito and Vector Control District
Thanks for signing up!
There was an error saving your request. Please make sure you entered a valid email.
San Mateo County Mosquito and Vector Control District is fully committed to providing accessible facilities, elements and
channels of communication to all members of the public. As part of this commitment, San Mateo County Mosquito and Vector Control District
has a policy of providing an accessible website compatible with the Web Content Accessibility Guidelines (WCAG 2.1) and
commercial screen reading software. All features of the website are coded to allow individuals with vision and
other impairments to understand and use the website to the same degree as someone without disabilities. We welcome
feedback and can often resolve issues in a timely manner if they arise.
If you need any special assistance or accommodations:
San Mateo County Mosquito and Vector Control District has designated a compliance officer for website disability-related accommodations.
The compliance officer has received training in website accessibility and updates the site in accordance with those best
practices. Contact our accessibility officer to report an issue.
Compliance Procedures and Reports
In addition to testing with users with a wide range of disabilities and coding our website to WCAG standards,
San Mateo County Mosquito and Vector Control District regularly scans its website to ensure ongoing compliance, and makes timely
changes to any inaccessible changes, if any are found.
Linked Documents and Third Parties
Please note that this site may link out to third-party websites, such as state or federal agencies, that do
not have accessible content. This site may also include documents provided by third parties included in our
agenda packets, for example. While we cannot control the accessibility of content provided by third parties,
we are happy to assist any member of the public with reading and accessing content on our site.